

To calculate Scope 3 emissions, you map your value chain, identify which of the 15 GHG Protocol categories apply to your business, select a calculation method (spend-based, activity-based, supplier-specific, or hybrid), collect the relevant activity data, and multiply it by published emission factors to produce a figure in metric tonnes of CO2 equivalent (tCO2e).
The process is rarely perfect in year one, but it does not need to be. What it needs to be is defensible, documented, and consistent year-on-year.
If you are a CFO, sustainability lead, or head of risk being asked to produce Scope 3 numbers for the first time, and you are finding the available guidance either too technical or too vague to act on, this guide is for you. It covers the full scope 3 emissions calculation process from boundary-setting to worked examples, with real emission factors and direct links to the databases you will actually use.
Accurate Scope 3 numbers are also the prerequisite for any credible mitigation target or net zero commitment — not an input you can estimate loosely and correct later.
This GHG Protocol explainer sets out why the baseline you build today determines the credibility of every reduction claim you make against it.
The 4-step framework for how to calculate Scope 3 emissions
Before diving into detail, here is the process at a glance:
Each step is covered in detail below.
Step 1: Map your value chain
Scope 3 covers all indirect emissions that occur in your upstream and downstream activities — everything that happens outside your own operations but as a direct result of them. The GHG Protocol defines the organisational boundary as: All emissions your company causes others to produce, either by purchasing goods and services (upstream) or by selling products that are used, transported, or disposed of (downstream).
Getting this boundary right before you calculate anything is the most important decision you will make. A poorly defined boundary produces numbers that cannot be compared year-on-year, and that will not hold up under third-party assurance.
Upstream emissions include: Purchased goods and services, capital goods, fuel and energy-related activities not already in Scope 1 or 2, upstream transportation, waste generated in operations, business travel, employee commuting, and upstream leased assets.
Downstream emissions include: Downstream transportation and distribution, processing of sold products, use of sold products, end-of-life treatment of sold products, downstream leased assets, franchises, and investments.
The most common boundary mistakes:
Firstly, over-inclusion i.e. adding categories that do not apply. A software company does not have meaningful Category 11 (use of sold products) emissions if its product consumes negligible electricity at the user end. Including it anyway inflates the inventory without adding signal.
Secondly, under-inclusion i.e. omitting categories that do apply because the data is hard to get. If purchased goods and services represent 60% of your spend, Category 1 is almost certainly material, regardless of how difficult it is to measure.
Thirdly, confusing Scope 2 and Scope 3 i.e. electricity you purchase and consume directly is Scope 2. Electricity consumed upstream by your suppliers in producing goods you buy is Scope 3 Category 1 or Category 3, depending on context. These are different boundaries and should not be double-counted.
A real boundary decision
A mid-size manufacturer of packaging materials buys steel, polymers, and cardboard as raw inputs. It also uses third-party freight carriers to deliver finished goods to customers.
Its Scope 3 inventory should include Category 1 (purchased goods), Category 4 (upstream transportation), and Category 9 (downstream transportation).
It should not include Category 11 (use of sold products) because packaging materials are not energy-consuming in use.
That is a defensible, documented boundary decision — which is exactly what auditors and regulators are looking for.
Here is how Credibl helped a global enterprise bring structure to Scope 3 data flows — including backdated supplier assessments across Categories 1 and 2 — without adding complexity for the teams doing the work. Read the case study→
Step 2: The 15 Scope 3 categories – And which ones apply to your business
The GHG Protocol’s Corporate Value Chain (Scope 3) Standard defines 15 categories of value chain emissions. They are designed to be mutually exclusive — meaning a single activity should not appear in two categories. The table below gives you the full picture.
| # | Category | What is included | Who it typically applies to | Most common calculation method |
|---|---|---|---|---|
| 1 | Purchased goods and services | Cradle-to-gate emissions from production of all goods and services purchased | All companies | Spend-based or average-data |
| 2 | Capital goods | Emissions from production of capital equipment, machinery, buildings | Manufacturing, infrastructure, retail | Spend-based |
| 3 | Fuel- and energy-related activities | Upstream extraction and processing of fuels and energy purchased (not in Scope 1/2) | Energy-intensive industries | Activity-based |
| 4 | Upstream transportation and distribution | Freight movement of purchased goods to reporting company | Manufacturing, retail, distribution | Activity-based (ton-mile) |
| 5 | Waste generated in operations | Disposal and treatment of waste from company operations | Manufacturing, hospitality, healthcare | Activity-based (waste weight x disposal method) |
| 6 | Business travel | Air, rail, and road travel by employees for business purposes | Professional services, consulting | Activity-based (passenger-mile) |
| 7 | Employee commuting | Emissions from employees travelling between home and office | All companies with on-site staff | Activity-based or spend-based |
| 8 | Upstream leased assets | Operations of assets leased by reporting company (not in Scope 1/2) | Companies with leased equipment or facilities | Activity-based |
| 9 | Downstream transportation and distribution | Freight movement of sold goods to customers | Manufacturing, retail, e-commerce | Activity-based (ton-mile) |
| 10 | Processing of sold products | Emissions from processing of intermediate goods by downstream customers | Companies selling intermediate inputs | Activity-based |
| 11 | Use of sold products | Energy consumed by products during their use phase | Electronics, appliances, vehicles, energy systems | Activity-based (product lifetime energy use) |
| 12 | End-of-life treatment of sold products | Waste disposal and treatment of products at end of life | Manufacturers of physical goods | Activity-based (waste weight x disposal method) |
| 13 | Downstream leased assets | Operations of assets owned by company but leased to others | Property, equipment leasing companies | Activity-based |
| 14 | Franchises | Operations of franchisee businesses | Franchise operators (fast food, hospitality, retail) | Activity-based |
| 15 | Investments | Financed emissions from equity, debt, and project finance | Banks, asset managers, insurers, PE funds | PCAF methodology |
Getting Scope 3 right starts with asking suppliers the right questions. Wrong inputs produce wrong outputs and wrong outputs, once submitted, become a compliance liability.

Not all 15 categories will be relevant to your business. The GHG Protocol permits companies to exclude categories that are not applicable, or where emissions are genuinely not significant, provided the decision is disclosed and justified. What it does not permit is excluding categories simply because the data is inconvenient.
Here’s a deeper breakdown of these 15 Categories.
Step 3: Calculation methods
There are four methods for calculating Scope 3 emissions under the GHG Protocol framework. Choosing the right one depends on the data you actually have, not the data you would ideally like.
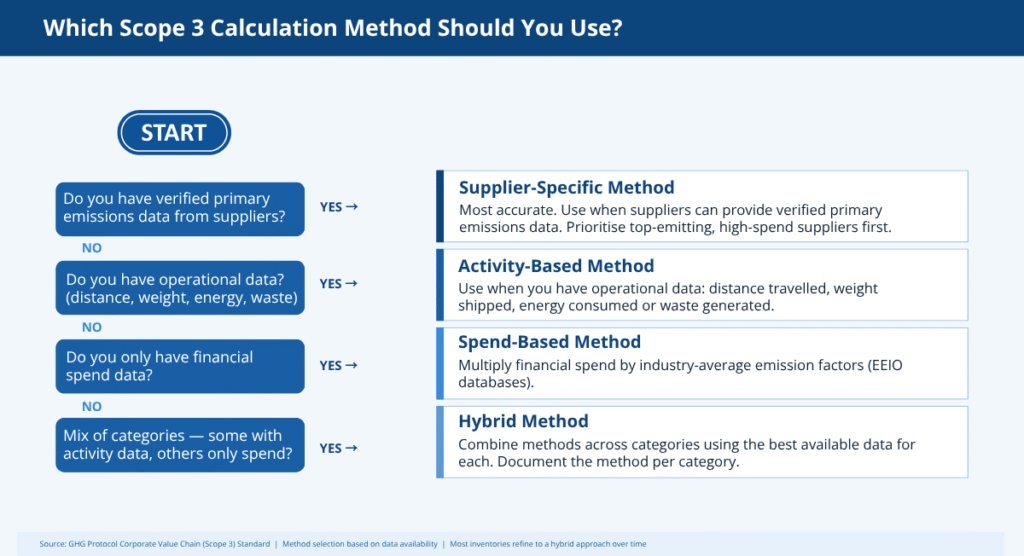
Supplier-specific method
You obtain primary emissions data directly from individual suppliers, typically via sustainability questionnaires, CDP disclosures, or third-party verified reports. This is the most accurate approach available.
When to use it: High-spend, high-emission suppliers where the effort of data collection is justified by materiality. It is also increasingly expected by frameworks such as SBTi’s supplier engagement requirement for Category 1.
Main limitation: Supplier data quality is uneven. Data provided in a questionnaire that has not been third-party verified should not be treated as audit-ready. Document your verification process and assumptions.
Activity-based method
You collect operational data (distance travelled, weight of goods, energy consumed, number of nights stayed) and multiply by a mode-specific or activity-specific emission factor from a recognised database.
When to use it: Categories where operational data is accessible — transportation (Categories 4, 6, 7, 9), waste (Category 5), and business travel (Category 6). This method is more accurate than spend-based and produces numbers that are easier to act on.
Main limitation: Requires detailed data from across the organisation and supply chain. For large enterprises with complex operations, collection can be time-consuming and dependent on supplier cooperation.
Spend-based method
You multiply the amount spent on a good or service by an industry-average emission factor (expressed in kgCO2e per dollar of spend). Emission factors come from economic input-output (EEIO) databases such as the EPA’s Supply Chain GHG Emission Factors dataset.
When to use it: Early-stage inventories, categories where activity data is unavailable, or as a first-pass screen to identify material hotspots before investing in more granular data collection.
Main limitation: Spend-based figures are estimates, not measurements. They do not reflect variation in production methods, geography, or supplier efficiency. Two suppliers producing identical goods may have dramatically different actual emission intensities — spend-based data will not capture that.
Hybrid method
You combine two or more of the above methods across different categories, using the best available data for each. Most mature Scope 3 inventories are hybrid inventories.
When to use it: When you have activity data for some categories and only spend data for others — which describes most companies beyond year one.
Main limitation: Requires careful documentation of which method was used for each category to avoid inconsistency when comparing across years.
Decision tree: Choosing your calculation method
Use this logic to select the right method for each category:
Step 4: Data collection
Where to find your data
Emissions data for a Scope 3 inventory comes from several sources, and most companies will need to use all of them:
Internal systems: ERP and procurement systems contain spend data by supplier and category — the foundation of a spend-based inventory. Finance teams running this process for the first time will find this is often the most accessible starting point.
Supplier surveys and CDP disclosures: Direct supplier engagement produces activity-based and supplier-specific data. CDP’s supply chain programme gives large companies access to standardised supplier disclosures from thousands of reporting companies.
Government and industry databases: The key databases for greenhouse gas calculations include the:
- US EPA GHG Emission Factors Hub (updated annually, with extensive coverage of Scope 1, Scope 2, and many Scope 3 categories)
- UK DEFRA GHG Conversion Factors (updated annually and widely used internationally for freight, travel, energy, and other activities)
- US Supply Chain Greenhouse Gas Emission Factors EEIO dataset (Version 1.3, a spend-based dataset suitable for Scope 3 Category 1 purchased goods and services), and
- PCAF Global GHG Accounting and Reporting Standard for the Financial Industry, which provides methodologies for Scope 3 Category 15 financed emissions
Full links and descriptions for each are in the Tools and Resources section below.
Secondary data: Where primary or activity data is not available, the GHG Protocol allows use of industry averages, government statistics, and sector benchmarks. Secondary data should be disclosed as such, and your assumptions documented.
It is not a shortcut — it is a legitimate tool for categories where direct data collection is not yet possible.
Handling data gaps
Every Scope 3 inventory has gaps. The GHG Protocol’s de minimis rule allows companies to exclude sources that contribute less than 1% of total Scope 3 emissions, provided total excluded emissions stay below 5% of the inventory. This is not a licence to skip hard categories — it is a threshold for genuinely immaterial sources.
Where data is missing but the category is material, use a conservative estimate (one that is more likely to overstate than understate emissions), document your assumption, and flag it as an area for improvement in the next reporting cycle.
Transparency about gaps is not a weakness in a Scope 3 inventory — it is a sign of a credible one.
Materiality screening is worth doing before you start collecting data, not after. Run a rapid spend-based estimate across all 15 categories to identify where 80% of your likely emissions sit. Focus your data collection effort on those categories first. You will get a better inventory faster, and you will not waste six months collecting granular freight data for a category that turns out to be 0.3% of your total footprint.

Scope 3 in practice: Two real calculations
Tracking emissions across upstream transportation, downstream transportation, and other value chain partners is where most carbon footprint calculations either hold up or fall apart. Accurate data makes the difference. Here is what it looks like to actually calculate emissions for two common scenarios.
Example 1: Manufacturing company — Category 4 (Upstream transportation)
A mid-size US manufacturer ships 500 tonnes of raw steel from a domestic supplier, transported by road freight over an average distance of 800 miles.
Method: Activity-based (ton-mile method)
Data required: Weight of goods (tonnes), distance travelled (miles), transport mode
Calculation:
- Freight volume: 500 tonnes × 800 miles = 400,000 ton-miles
- Emission factor for medium/heavy-duty truck freight: 0.186 kg CO2e per tonne-mile (Source: EPA GHG Emission Factors Hub 2025, Table 9)
- Emissions: 400,000 × 0.186 = 74,400 kg CO2e = 74.4 tCO2e
This figure covers combustion emissions only (tank-to-wheel). If well-to-wheel coverage is required under your reporting framework, apply the upstream fuel factor from the same EPA table.
Example 2: Financial services firm — Category 6 (Business travel, air)
A mid-size US professional services firm with 200 employees records 150 medium-haul business flights in a reporting year (average flight distance: 1,200 miles one-way).
Method: Activity-based (passenger-mile method)
Data required: Number of flights, average distance, flight category
Calculation:
- Total passenger-miles: 150 flights × 1,200 miles = 180,000 passenger-miles
- Emission factor for medium-haul flight (300–2,300 miles): 0.129 kg CO2e per passenger-mile (Source: EPA GHG Emission Factors Hub 2025, Table 8 — Business Travel)
- Emissions: 180,000 × 0.129 = 23,220 kg CO2e = 23.2 tCO2e
Note: This figure does not include radiative forcing (RF) uplift. Some reporting frameworks, including CSRD and several voluntary standards, require RF factors to be applied to aviation emissions, which typically doubles the CO2e figure. Disclose which approach you are using.
Common pitfalls
Getting Scope 3 wrong is no longer just a methodology problem. Forrester’s 2026 sustainability predictions flag that three Fortune 1000 companies will be publicly exposed for erroneous sustainability reporting this year — pointing directly at fragmented spreadsheets, manual inputs, and opaque supplier estimates as the root cause. The pitfalls below are where most of those errors originate.
Double-counting between categories
Category 1 (purchased goods and services) is a catch-all for upstream emissions not covered by Categories 2 through 8. If you also calculate Category 4 (upstream transportation), make sure the transportation component is not already embedded in your Category 1 spend-based figure. If it is, either exclude it from Category 1 or use a hybrid method that separates them cleanly.
Currency fluctuation errors in spend-based calculations
Spend-based emission factors are expressed in emissions per unit of currency (e.g. kgCO2e per USD). If your financial data is in a different currency, or you are comparing year-on-year figures across periods of significant exchange rate movement, the resulting emissions change may reflect currency movement rather than actual changes in purchasing activity. Always deflate spend data to a consistent base year before applying EEIO factors.
Treating supplier data as audit-ready when it is not
Supplier questionnaire responses are useful inputs, but they are not third-party verified data. If a supplier self-reports that their production process generates X tCO2e per tonne of output, and that figure has not been externally assured, do not present it in your inventory at the same level of confidence as your activity-based calculations. Document the data source and its verification status for every category.
Boundary inconsistency year-on-year
If you expand your Scope 3 boundary between reporting years — adding categories, changing organisational scope, or switching from spend-based to activity-based for a major category — your total emissions will change, but not because your actual emissions changed. Restate the prior year using the new boundary. Without restated comparators, year-on-year reductions or increases are meaningless.
Applying Scope 2 factors to Scope 3 categories
The electricity emission factor you use for Scope 2 (location-based or market-based grid factor) is not the correct factor for upstream electricity consumption embedded in purchased goods. Scope 3 Category 1 emissions from electricity-intensive manufactured products should use the emission factor for the country or region where production takes place, not your own site’s grid factor.
Tools and resources
The following are the primary references for any Scope 3 calculation process — covering varying degrees of data availability, from first-pass estimates to standardised reporting aligned with science-based targets and net zero emissions commitments.
- GHG Protocol Corporate Value Chain (Scope 3) Standard: The foundational accounting standard for all Scope 3 inventories. Required reading before you build your boundary. [LINK: https://ghgprotocol.org/corporate-value-chain-scope-3-standard]
- GHG Protocol Scope 3 Calculation Guidance: The companion document with worked examples for all 15 categories. [LINK: https://ghgprotocol.org/scope-3-calculation-guidance-2]
- EPA GHG Emission Factors Hub: Updated January 2025. The standard reference for US-based activity factors covering transportation, travel, waste, and commuting. [LINK: https://www.epa.gov/climateleadership/ghg-emission-factors-hub]
- EPA Supply Chain GHG Emission Factors (EEIO) v1.3: Covers 1,016 US commodity categories at 6-digit NAICS level. The standard reference for spend-based Category 1 calculations. [LINK: https://catalog.data.gov/dataset/supply-chain-greenhouse-gas-emission-factors-v1-3-by-naics-6]
- UK DEFRA Greenhouse Gas Conversion Factors: Updated annually. Widely used internationally for freight, travel, and energy emission factors. [LINK: https://www.gov.uk/government/collections/government-conversion-factors-for-company-reporting]
- PCAF Global GHG Accounting and Reporting Standard: The required methodology for Category 15 financed emissions. Mandatory for financial institutions reporting under ISSB IFRS S2 or CSRD. [LINK: https://carbonaccountingfinancials.com/standard]
- Credibl: For teams that have moved past spreadsheets, Credibl automates data collection and calculation across all 15 categories, with built-in emission factor libraries, audit-ready documentation, and multi-framework reporting for CSRD, SB 253, IFRS S2, and BRSR.
Frequently asked questions
Q1: Do I need to report all 15 Scope 3 categories?
No — but you need to justify which ones you exclude. The GHG Protocol requires companies to report all relevant categories and disclose any exclusions with a documented rationale. Categories can be excluded if they are genuinely not applicable to your business model or if they fall below the de minimis threshold (less than 1% of total Scope 3, with total excluded sources below 5%). Simply excluding categories because the data is difficult to obtain is not an acceptable justification under any major disclosure framework, including CSRD, IFRS S2, or SB 253.
Q2: What is a reasonable accuracy level for Scope 3 calculations?
The GHG Protocol does not specify a percentage accuracy requirement, because Scope 3 is inherently an estimation exercise. What it requires is that your inventory be complete, consistent, transparent, accurate, and relevant — the five accounting principles. In practice, a first-year inventory built primarily on spend-based data will carry significant uncertainty. That is acceptable, provided you document your methodology, disclose your data sources, and improve data quality over time. Third-party assurance of Scope 3 at limited assurance level is increasingly expected under CSRD and voluntary frameworks.
Q3: What is the difference between Scope 3 and Scope 1 emissions?
Scope 1 covers direct emissions from sources your organisation owns or controls — combustion in your own facilities, fuel in your own fleet vehicles, and process emissions from your own manufacturing operations. Scope 3 covers indirect emissions that occur outside your direct control, across your entire value chain. The key distinction is ownership and control: if you own the asset producing the emissions, it is Scope 1. If someone else owns it and produces emissions as a result of doing business with you, it is almost certainly Scope 3.
Q4: How do I handle categories where I have no supplier data?
Use secondary data. The GHG Protocol explicitly permits the use of industry averages, government statistics, and sector benchmarks where primary supplier data is not available. The EPA’s supply chain emission factors dataset and sector-level EEIO databases provide defensible secondary data for most Category 1 spend categories. Document the source, flag it as secondary, and include a plan for improving data quality in subsequent years. For high-spend suppliers, consider making primary data disclosure a procurement requirement.
Q5: Can Scope 3 emissions be calculated in-house without specialist software?
Yes, for smaller organisations with straightforward supply chains. The GHG Protocol publishes Excel-based calculation tools for each of the 15 categories, available free at ghgprotocol.org. For companies with complex supply chains, multiple geographies, or disclosure obligations under CSRD, SB 253, or IFRS S2, manual spreadsheet-based calculation becomes a material risk in itself — version control errors, inconsistent factor updates, and missing audit trails are common failure modes. At that point, a purpose-built platform is not a luxury, it is a risk management decision.
Book a demo to see automated Scope 3 calculation in action, with live data ingestion, built-in factor libraries, and audit-ready output for CSRD, IFRS S2, and SB 253.