If you’ve started mapping your company’s carbon footprint, you’ve probably hit the wall that is Scope 3. Scope 1 covers direct emissions from your own operations. Scope 2 is your energy bills. Scope 3 is everything else across your entire value chain and everything else turns out to be a lot.
The Greenhouse Gas Protocol’s Corporate Value Chain (Scope 3) Standard divides these indirect greenhouse gas emissions into 15 categories. The structure exists for good reason: it creates a consistent reporting boundary, prevents double-counting across upstream and downstream activities, and gives a reporting organization a systematic way to identify where its biggest carbon footprint exposure actually lives.
For most companies, Scope 3 accounts for the majority of total GHG emissions inventory. That makes understanding the categories less of an academic exercise and more of a practical business priority — especially as regulatory requirements like California’s SB 253, the EU’s CSRD, and IFRS S2 make Scope 3 disclosure a legal requirement rather than a nice-to-have.
The response from the market is telling. According to Verdantix’s 2025 Global Corporate ESG and Sustainability Survey, 25% of companies already use AI for sustainability report preparation, with a further 64% planning to follow before end of 2027.
This is also why AI-backed ESG platforms are emerging as the practical answer, automating data ingestion, validating supplier inputs, and turning 15 categories of fragmented value chain emissions into something audit-ready.

This guide covers all 15 categories, what each one includes, who it applies to, how it’s typically measured, and where companies most commonly go wrong.
Jump to a category
Category 1 | Category 2 | Category 3 | Category 4 | Category 5 | Category 6 | Category 7 | Category 8 | Category 9 | Category 10 | Category 11 | Category 12 | Category 13 | Category 14 | Category 15 |
Upstream vs. downstream: The core organising principle
Before diving into individual categories, it helps to understand the split.
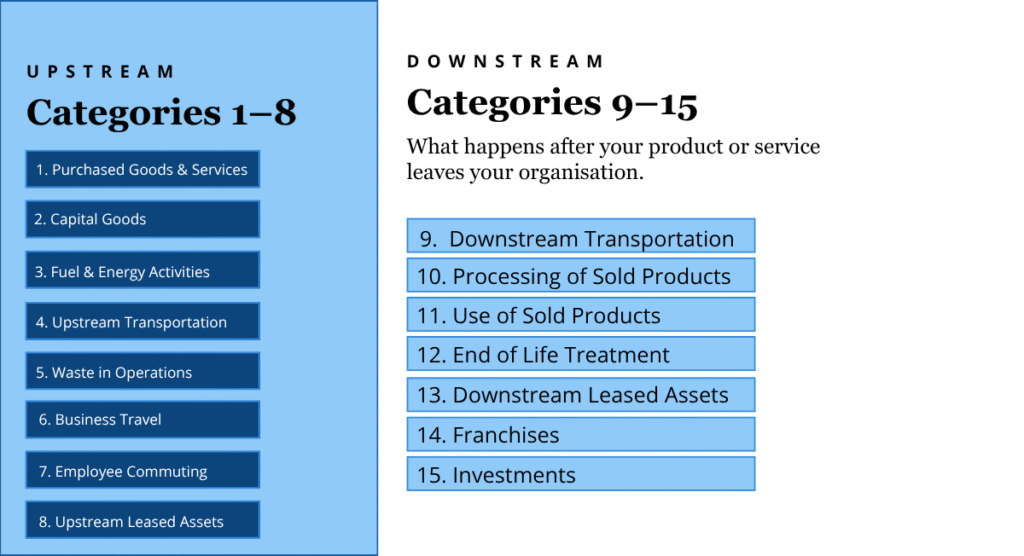
Upstream emissions (Categories 1–8) cover everything that happens before a product or service reaches your organisation — your supply chain inputs, the energy you consume, how your people travel, and the assets you lease or purchase.
Downstream emissions (Categories 9–15) cover everything that happens after your product or service leaves your organisation — how it’s transported, how customers use it, and what happens to it at end of life.
The GHG Protocol designs the 15 categories to be mutually exclusive, but in practice, overlap errors are common.
We’ll flag the most frequent ones as we go.
Upstream categories: Carbon emissions from your supply chain inputs
Category 1: Purchased goods and services
What it covers: Emissions from the production of everything your organisation buys — raw materials, components, packaging, and any services from third parties. This is typically the largest Scope 3 category for manufacturers, retailers, and technology companies.
Who it applies to: Almost every organisation. If you buy anything to run your business, you have Category 1 emissions.
How it’s typically measured: Spend-based methods (applying emission factors to procurement spend) are the most common starting point. Activity-based methods using supplier-specific data are more accurate but require supplier engagement to collect primary data. Most organisations begin with spend-based and improve over time.
Common pitfall: Confusing Category 1 with Category 2. The GHG Protocol lets you decide what counts as a capital good vs. a purchased service — but you cannot count the same item in both. Double-counting here is one of the most frequent errors in Scope 3 inventories.
Category 2: Capital goods
What it covers: Emissions from producing the long-lived assets your organisation acquires — machinery, buildings, IT infrastructure, vehicles, and equipment. Think of it as the embedded carbon in the things you buy once and use for years.
Who it applies to: Capital-intensive industries: manufacturing, construction, data centres, logistics, and energy. Also increasingly relevant for technology companies investing in hardware infrastructure.
How it’s typically measured: Spend-based emission factors from databases like EXIOBASE or Ecoinvent are commonly used. The GHG Protocol requires you to account for cradle-to-gate emissions in the year of acquisition — not spread over the asset’s useful life as you would in financial accounting.
Common pitfall: Treating capital goods the same way your finance team depreciates them. For GHG purposes, all the embedded emissions land in the year you acquire the asset. This often surprises teams used to financial accounting conventions.
Category 3: Fuel- and energy-related activities
What it covers: Upstream emissions from extracting, producing, and transporting the fuels and electricity your organisation consumes — the parts not already captured in Scope 1 or Scope 2. This includes transmission and distribution (T&D) losses from your purchased electricity.
Who it applies to: Every organisation that uses energy. It is often considered best practice to report this category even when companies use market-based Scope 2 accounting, because the upstream extraction emissions exist regardless of the energy’s origin.
How it’s typically measured: Emission factors published by national energy agencies or the IEA, applied to energy consumption data from utility bills and fuel purchase records.
Common pitfall: Assuming this category is already covered by Scope 1 and Scope 2. It isn’t. The combustion of fuel is Scope 1. The emissions from producing and delivering that fuel are Category 3.
Category 4: Upstream transportation and distribution
What it covers: Emissions from transporting goods to your organisation — inbound freight, third-party logistics, and warehousing before the point of sale. Vehicles and facilities are not owned or controlled by your company.
Who it applies to: Retailers, importers, distributors, and any organisation with complex inbound supply chains. For companies that source globally, this category can be significant.
How it’s typically measured: Tonne-kilometre data combined with modal emission factors (road, rail, sea, air). The GLEC Framework is a widely used methodology for logistics emissions.
Common pitfall: Confusing upstream (Category 4) with downstream (Category 9) transportation. The split is simple: inbound to you is Category 4, outbound from you is Category 9. Getting this wrong creates double-counting risk.
Category 5: Waste generated in operations
What it covers: Emissions from disposing of waste your operations produce — landfill, incineration, recycling, and composting at third-party facilities. If the waste is treated on-site, those emissions belong in Scope 1.
Who it applies to: Manufacturing, chemicals, food and beverage, and any sector with high operational waste output. Extended Producer Responsibility (EPR) regulations are making this category increasingly scrutinised.
How it’s typically measured: Waste volume data by disposal method, multiplied by waste-type emission factors. Most organisations can get this data from waste contractor invoices and site waste management records.
Common pitfall: Only reporting landfill waste and ignoring incineration and recycling. All disposal methods have associated emissions and all should be included.
Category 6: Business travel
What it covers: Emissions from employees travelling for business purposes in third-party vehicles — flights, trains, hotels, and rental cars. If your company owns the vehicle, those emissions are Scope 1.
Who it applies to: Professional services, consulting, finance, and technology companies with globally distributed teams. For many service-sector companies, this is the largest or second-largest Scope 3 category.
How it’s typically measured: Distance-based emission factors applied to travel data from expense management systems, travel booking platforms, or finance records. Air travel typically dominates, with long-haul flights carrying significantly higher emission factors than short-haul.
Common pitfall: Excluding hotel stays and rental cars. Both are within the GHG Protocol’s minimum boundary for Category 6 and should be included for a complete inventory.
Category 7: Employee commute
What it covers: Emissions from employees travelling between home and work — in personal cars, public transport, or any other mode not owned by the company.
Who it applies to: Any organisation with office-based or site-based staff. Hybrid and remote work policies have a direct, measurable effect on this category — making it worth tracking year-on-year to demonstrate climate strategy progress.
How it’s typically measured: Commuting surveys combined with distance and modal split assumptions. Industry averages and secondary data are commonly used when primary survey data is unavailable.
Common pitfall: Setting and forgetting. Companies that shifted to hybrid working post-2020 often have outdated commuting baselines that overstate current emissions. Worth refreshing with current data.
Category 8: Upstream leased assets
What it covers: Emissions from assets leased by your organisation that are not already captured in your Scope 1 or Scope 2 reporting. Think office buildings, data centre co-location space, or equipment you lease from third parties.
Who it applies to: Technology companies, financial services firms, and any organisation that leases significant infrastructure rather than owning it. Less commonly material than other upstream categories but required for reporting completeness.
How it’s typically measured: Energy consumption data from leased facilities, using the same emission factors applied to Scope 2 for owned buildings.
Common pitfall: Confusing Category 8 (you lease the asset) with Category 13 (you own the asset and lease it to others). The direction of the lease determines which category applies.

Downstream activities: Carbon emissions beyond your direct control
Category 9: Downstream transportation and distribution
What it covers: Emissions from transporting finished goods from your organisation to end customers — including third-party distributors, retailers, and e-commerce fulfilment networks. The key difference from Category 4 is direction: this is outbound.
Who it applies to: Consumer goods, pharmaceutical, and retail companies with long distribution chains. Also relevant for B2B manufacturers shipping to industrial customers.
How it’s typically measured: The same GLEC Framework methodology used for Category 4, applied to outbound logistics data. Many companies with complex distribution networks find this category requires close collaboration with logistics providers to get accurate data.
Common pitfall: Omitting the last-mile delivery leg. For e-commerce companies in particular, last-mile emissions can be significant and are frequently excluded from initial inventories.
Category 10: Processing of sold products
What it covers: Emissions from downstream processing of intermediate products your organisation sells to other businesses — for example, a chemical manufacturer whose customers further refine or process the product before sale to end users.
Who it applies to: B2B manufacturers of intermediate goods: chemicals, materials, components, and industrial inputs. Service companies and final-product manufacturers typically exclude this category with justification.
How it’s typically measured: Emission factors applied to the processing activities customers typically perform. This usually requires industry data or customer engagement to understand downstream use patterns.
Common pitfall: Reporting this category when you sell finished products. Category 10 only applies when your product requires further processing by the buyer before it reaches an end user.
Category 11: Use of sold products
What it covers: Emissions generated when customers use your products over their lifetime. This includes direct use emissions (fuel combustion in vehicles you sell) and indirect use emissions (electricity consumed by appliances or electronics you manufacture).
Who it applies to: Automotive, electronics, appliances, and energy equipment manufacturers. For these industries, Category 11 is often the single largest Scope 3 category — and the primary lever for product-level carbon reduction efforts.
How it’s typically measured: Product sales volumes multiplied by lifetime use emission factors. For energy-using products, this requires assumptions about usage patterns, product lifetime, and the emission intensity of the energy grid where customers operate.
Common pitfall: Underestimating the scale. For an automaker or electronics manufacturer, Category 11 can represent 80% or more of total emissions inventory. Companies that treat it as an afterthought often discover this too late.
Category 12: End of life treatment of sold products
What it covers: Emissions from disposing of your products after customers are done with them — landfill, incineration, recycling, and reuse at end of life. Calculated based on product sales volumes and assumed end-of-life disposal scenarios.
Who it applies to: Product manufacturers across sectors. Particularly relevant under Extended Producer Responsibility (EPR) schemes and circular economy frameworks, where brands increasingly bear responsibility for their products’ full life cycle.
How it’s typically measured: Product weight and material composition data, combined with end-of-life scenario assumptions and disposal method emission factors.
Common pitfall: Using optimistic end-of-life assumptions that don’t reflect actual disposal behaviour. Assuming 100% recycling when the real-world recycling rate for your product category is 30% will materially understate your Category 12 emissions.
Category 13: Downstream leased assets
What it covers: Emissions from assets your organisation owns but leases to others — relevant for real estate companies, vehicle fleet lessors, and equipment rental businesses. You own the asset; someone else operates it.
Who it applies to: Real estate investment trusts, vehicle leasing companies, and industrial equipment rental businesses. The reporting company bears responsibility for these emissions because it controls the asset design and selection, even if it doesn’t operate it.
How it’s typically measured: Energy consumption data from lessees, using building or vehicle emission factors. Obtaining this data often requires lessee reporting obligations in lease agreements.
Common pitfall: Confusing this with Category 8. To repeat: Category 8 is assets you lease from others. Category 13 is assets you own and lease to others.
Category 14: Franchises
What it covers: Emissions from operations run by franchisees under your brand and business model. The franchisor is responsible for reporting the franchise network’s Scope 1 and Scope 2 emissions within Category 14.
Who it applies to: Food service, retail, hospitality, and any company operating a franchise model. As stakeholders hold brands accountable for their full network footprint, franchisors are under increasing pressure to report this category accurately.
How it’s typically measured: Franchisee-level energy consumption and operational data, aggregated across the network. This requires active data collection from franchisees — which is where most franchisors currently struggle.
Common pitfall: Reporting only company-owned locations and excluding franchise sites. For major franchise brands, the franchise network can represent 80–90% of total operations. Excluding it produces a materially incomplete picture.
Category 15: Investments (financed emissions)
What it covers: Emissions associated with an organisation’s equity investments, debt holdings, and project finance — what the financial sector calls financed emissions. This is calculated using the PCAF (Partnership for Carbon Accounting Financials) standard, which assigns a share of portfolio companies’ emissions to the investor or lender based on ownership or exposure.
Who it applies to: Banks, asset managers, insurers, pension funds, and any organisation with a significant investment portfolio. For financial institutions, Category 15 is frequently the only category that materially matters — and can dwarf all other categories combined.
How it’s typically measured: PCAF methodology assigns financed emissions based on attribution factors derived from the financial value of holdings relative to portfolio companies’ enterprise value. Data quality scores (1–5) are used to indicate reliability.
Common pitfall: Treating Category 15 as optional because the data is hard to obtain. Under CSRD ESRS E1 and the Net Zero Banking Alliance, financed emissions disclosure is increasingly mandatory. The complexity of measurement is not an acceptable reason for exclusion.
Platforms that can ingest structured and unstructured financial data — including public disclosures from portfolio companies — significantly reduce the manual effort involved in building a defensible Category 15 inventory.
How to decide which categories to report on
Not every category will be material for every organisation. The GHG Protocol requires you to identify relevant categories, report on them, and explain why excluded categories are not relevant to your business.
A practical screening process works as follows. Start with spend-based estimates or industry averages to size each category roughly. Prioritise categories where emissions are likely to be significant, where reduction opportunities exist, and where key stakeholders (regulators, customers, investors) expect disclosure.
The GHG Protocol’s Technical Guidance and CDP’s Sector Relevance matrices are useful reference points for this screening. Most organisations find that 3–5 categories account for the majority of their Scope 3 footprint — so precision effort is best concentrated there first.
One nuance worth flagging: CSRD’s double materiality standard adds a second test. A category can be material not just because of its financial significance to your company, but because of its environmental impact across the value chain. Categories with high environmental impact must be reported even if they are not financially material to your operations.
For companies working across multiple reporting frameworks — CSRD, SB 253, IFRS S2, BRSR — the materiality thresholds and category requirements differ. Getting your Scope 3 data into a unified, audit-ready system from the outset avoids the expensive rework of trying to reconcile fragmented datasets when disclosure deadlines arrive.
The other hard part is the supplier side. Most of your Scope 3 data lives outside your four walls, and the categories that matter most (Cat 1, Cat 4, Cat 11) all depend on suppliers being able to give you usable answers.
Our Scope 3 Supplier Engagement Workbook tells you how to tier suppliers, match questionnaires to supplier type, and build the audit-ready paper trail SB 253 will require from 2027.
Sector relevance: Which categories matter most
The table below shows which Scope 3 categories are typically most material by sector. This is a starting point for your screening process, not a substitute for your own materiality assessment.
| Sector | Sub-sector | Typically most material categories |
| Manufacturing | General Manufacturing | Category 1, 4, 9, 11, 12 |
| Manufacturing | Automotive | Category 1, 4, 11, 12 |
| Manufacturing | Chemicals | Category 1, 3, 11, 12 |
| Manufacturing | Pharmaceuticals | Category 1, 4, 9, 5 |
| Manufacturing | Consumer Goods / FMCG | Category 1, 4, 9, 12 |
| Retail | E-commerce | Category 1, 4, 9, 12 |
| Retail | Brick and Mortar | Category 1, 4, 7, 12 |
| Technology | Hardware / Electronics | Category 1, 2, 11, 12 |
| Technology | Software / SaaS | Category 2, 6, 7, 8 |
| Technology | Data Centres / Cloud | Category 2, 3, 8, 11 |
| Financial Services | Banking | Category 15, 6, 7 |
| Financial Services | Asset Management | Category 15, 6, 7 |
| Financial Services | Insurance | Category 15, 6, 1 |
| Professional Services | Consulting | Category 6, 7, 1 |
| Professional Services | Legal and Accounting | Category 6, 7, 8 |
| Food and Beverage | Food Production / Agriculture | Category 1, 4, 9, 12 |
| Food and Beverage | Food Service / Restaurants | Category 1, 4, 7, 12 |
| Real Estate | Commercial Real Estate | Category 13, 3, 2 |
| Real Estate | Residential Development | Category 2, 1, 3 |
| Energy and Utilities | Oil and Gas | Category 11, 3, 1 |
| Energy and Utilities | Renewable Energy | Category 1, 2, 3 |
| Energy and Utilities | Utilities / Grid | Category 3, 1, 11 |
| Logistics and Transport | Road Freight | Category 1, 4, 9 |
| Logistics and Transport | Shipping / Maritime | Category 1, 4, 9 |
| Logistics and Transport | Aviation | Category 1, 4, 6, 11 |
| Construction and Engineering | Construction | Category 1, 2, 3, 4 |
| Construction and Engineering | Infrastructure | Category 1, 2, 4, 11 |
| Mining and Extractives | Mining | Category 1, 3, 4, 11 |
| Mining and Extractives | Oil and Gas Extraction | Category 1, 3, 11, 15 |
| Hospitality and Tourism | Hotels and Resorts | Category 1, 6, 7, 13 |
| Hospitality and Tourism | Travel and Tour Operators | Category 1, 4, 6, 11 |
| Media and Entertainment | Broadcasting / Streaming | Category 2, 6, 7, 8 |
| Media and Entertainment | Events and Live Entertainment | Category 1, 4, 6, 7 |
| Education | Universities and Schools | Category 1, 7, 6, 3 |
| Healthcare | Hospitals and Clinics | Category 1, 4, 5, 7 |
| Healthcare | Medical Devices | Category 1, 2, 11, 12 |
Frequently asked questions
Can the same emission appear in two categories?
No. The GHG Protocol designs the 15 categories to be mutually exclusive to prevent double-counting within a single organisation’s inventory. The most common overlap errors occur between Category 1 and Category 2 (purchased vs. capital goods), and between Category 4 and Category 9 (upstream vs. downstream transportation). If you find emissions appearing in two categories, one assignment is incorrect.
Do we have to report all 15 categories?
No. You report on categories that are relevant to your business and explain why excluded categories are not relevant. A best practice exclusion statement describes why the category does not apply — for example, a software company with no physical product would exclude Category 10 (processing of sold products) with a clear rationale. Unexplained exclusions create audit risk, particularly under SB 253 and CSRD.
What is the minimum boundary for a category?
Each category has a minimum boundary defined by the GHG Protocol — the activities that must be included at minimum. For example, Category 6 (business travel) must at minimum include flights and ground transport in third-party vehicles. Hotel stays are within the boundary but sometimes excluded in practice. Knowing the minimum boundary helps you understand what is required vs. what is aspirational.
How accurate does Scope 3 data need to be?
It depends on the category and the framework. Spend-based estimates are acceptable for low-priority or hard-to-measure categories. For categories that are material to your footprint, regulators and assurance providers expect higher data quality — ideally activity-based data with documented sources. SB 253 requires limited assurance for Scope 3 starting in 2027. Building a traceable data collection workflow now reduces the cost of getting there.
What’s the difference between primary and secondary data
Primary data is collected directly from your suppliers, customers, or operations — it’s specific to your value chain. Secondary data uses industry averages, emission factor databases, or spend-based proxies. The GHG Protocol recommends using primary data for material categories and secondary data for screening and lower-priority categories. The shift from secondary to primary data is where most organisations’ Scope 3 maturity journey ultimately leads.
What comes next
Understanding the 15 categories is the foundation. The harder part is building a data collection process that can actually populate them with defensible numbers across suppliers, logistics providers, franchisees, and investment portfolios.
As per Gartner’s 2025 research on Scope 3 decarbonisation, 89% of organisations are already using or actively searching for a digital solution to support their Scope 3 program — a clear signal that spreadsheets and manual workflows are no longer fit for purpose at the pace regulators are moving.
Explore how Credibl helps organisations measure, manage, and report across all 15 Scope 3 categories with audit-ready data, supplier engagement workflows, and framework alignment built in.
Once you know which categories apply to your business, the next segment is to actually calculate emissions across each one. Every category has its own data requirements — from energy consumed by your operations to supplier data you need to collect from chain partners — along with calculation methods and accuracy tradeoffs.
Getting this right is what separates a credible Scope 3 inventory from a compliance placeholder, and it matters more as companies work toward net zero targets and commitments aligned to the Science Based Targets initiative. Here’s how to start.